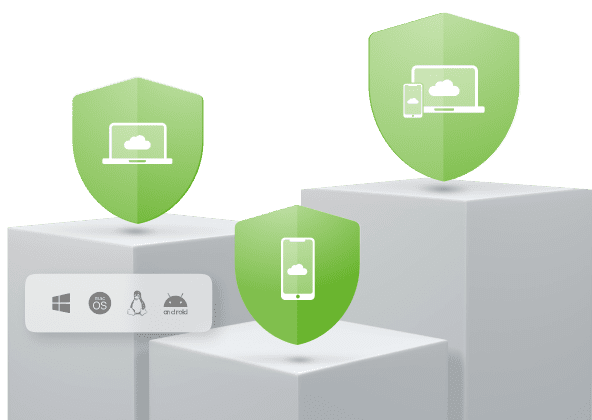
Антивирус Dr.Web по подписке
Оплачивайте онлайн-покупки, общайтесь с друзьями в соцсетях, смотрите видео и трансляции, загружайте приложения — все это безопасно с антивирусом Dr.Web по подписке
Безопасный цифровой мир от 1,63 ₽ в день
Надежно защищает от всех типов киберугроз: вредоносных и шпионских программ, программ-вымогателей, фишинговых атак и др.
Обеспечивает безопасность ваших персональных данных, банковских операций, онлайн-покупок и платежей
Не замедляет работу ваших устройств
Вам не нужно оплачивать лицензию сразу на год и более, чтобы оставаться защищенными на 100%
-
Выбирайте тот пакет, который подходит именно вам
-
Меняйте количество устройств в любой момент
-
Подключайте, приостанавливайте, возобновляйте подписку для своих устройств, когда вам необходимо
-
Платите только за то время, в течение которого использовали антивирус
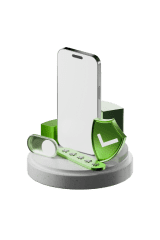
Пакет Мобильный
-
Непрерывная защита смартфона или планшета от всех типов мобильных угроз
-
Блокировка нежелательных звонков и СМС-спама
-
Поиск и удаленная блокировка потерянного устройства
1,63 ₽
за 1 устройство
Пакет Персональный
-
Надежная защита персонального компьютера от всех типов киберугроз
-
Блокировка доступа интернет-мошенников к веб-камере и микрофону
-
Защита от кражи личной информации
3,3 ₽
за 1 устройство
Пакет Расширенный
-
Единое решение для комплексной защиты компьютеров и мобильных устройств
4,63 ₽
Компоненты защиты
| Android | |
|---|---|
Антивирус.Преградит вход в защищаемую систему вирусам и вредоносному ПО, вылечит от уже проникших вирусов |
|
Родительский контроль.Заблокирует сайты по ключевым словам в URL и защитит детей от посещения нежелательных веб-ресурсов |
|
Брандмауэр.Возведет заслон на пути попыток хакеров вторгнуться в компьютер |
|
Антивор.Поможет найти мобильное устройство в случае его утери или кражи и при необходимости удаленно стереть с него конфиденциальную информацию. |
|
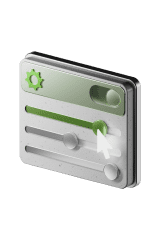
Аудитор безопасности.Произведет диагностику и анализ безопасности мобильного устройства, предложит решения для устранения выявленных проблем и уязвимостей. |
|
Фильтр звонков и СМС.Оградит от нежелательных звонков, СМС-сообщений и рекламных рассылок. |
| Windows | macOS | Linux | |
|---|---|---|---|
Антивирус.Преградит вход в защищаемую систему вирусам и вредоносному ПО, вылечит от уже проникших вирусов |
|||
Веб-антивирус SpIDer Gate.Обеспечит проверку веб-страниц в режиме реального времени, заблокирует фишинговые интернет-ресурсы, запретит доступ к нерекомендуемым и потенциально опасным сайтам |
|||
Антиспам.С высокой долей вероятности распознает спам независимо от языка сообщения, при близком к нулю проценте ложных срабатываний |
|||
Родительский контроль.Заблокирует сайты по ключевым словам в URL и защитит детей от посещения нежелательных веб-ресурсов |
|||
Брандмауэр.Возведет заслон на пути попыток хакеров вторгнуться в компьютер |
|||
Защита от эксплойтов.Защита от вредоносных объектов, пытающихся для проникновения в систему использовать уязвимости в популярных приложениях |
|||
Защита от вымогателей.Защита от троянцев-шифровальщиков на основе правил поведения программ этого типа |
|||
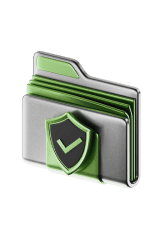
Защита от потери данных.Постоянная защита файлов в выбранных пользователем папках от несанкционированного изменения или удаления (отключена по умолчанию) |
|||
Приватность.Блокировка камеры и микрофона от несанкционированной записи звука и видео через устройство. |
|||
Блокировка съемных устройств.Заблокирует доступ к съемным носителям — флеш-картам и любым устройствам, подключаемым через USB-порт, включая веб-камеры, фотоаппараты и MP3-плееры. Функция запрета доступа к файлам, папкам и сменным носителям сделает невозможным несанкционированное использование, удаление или похищение информации |
|||
Облако Dr.Web.Проверит ссылку (URL) в режиме реального времени на серверах компании «Доктор Веб» |
|||
Превентивная защита.Защитит от новейших активных угроз, целевых атак и попыток проникновения, в том числе через уязвимости «нулевого дня» |
|||
Защита от потери данных.Постоянная защита файлов в выбранных пользователем папках от несанкционированного изменения или удаления (отключена по умолчанию) |
|||
Антивирусная сеть.Обеспечит управление защитой всех семейных компьютеров |
| Android | Windows | macOS | Linux | |
|---|---|---|---|---|
Антивирус.Преградит вход в защищаемую систему вирусам и вредоносному ПО, вылечит от уже проникших вирусов |
||||
Веб-антивирус SpIDer Gate.Обеспечит проверку веб-страниц в режиме реального времени, заблокирует фишинговые интернет-ресурсы, запретит доступ к нерекомендуемым и потенциально опасным сайтам |
||||
Антиспам.С высокой долей вероятности распознает спам независимо от языка сообщения, при близком к нулю проценте ложных срабатываний |
||||
Родительский контроль.Заблокирует сайты по ключевым словам в URL и защитит детей от посещения нежелательных веб-ресурсов |
||||
Брандмауэр.Возведет заслон на пути попыток хакеров вторгнуться в компьютер |
||||
Защита от эксплойтов.Защита от вредоносных объектов, пытающихся для проникновения в систему использовать уязвимости в популярных приложениях |
||||
Защита от вымогателей.Защита от троянцев-шифровальщиков на основе правил поведения программ этого типа |
||||
Защита от потери данных.Постоянная защита файлов в выбранных пользователем папках от несанкционированного изменения или удаления (отключена по умолчанию) |
||||
Приватность.Блокировка камеры и микрофона от несанкционированной записи звука и видео через устройство. |
||||
Блокировка съемных устройств.Заблокирует доступ к съемным носителям — флеш-картам и любым устройствам, подключаемым через USB-порт, включая веб-камеры, фотоаппараты и MP3-плееры. Функция запрета доступа к файлам, папкам и сменным носителям сделает невозможным несанкционированное использование, удаление или похищение информации |
||||
Облако Dr.Web.Проверит ссылку (URL) в режиме реального времени на серверах компании «Доктор Веб» |
||||
Превентивная защита.Защитит от новейших активных угроз, целевых атак и попыток проникновения, в том числе через уязвимости «нулевого дня» |
||||
Защита от потери данных.Постоянная защита файлов в выбранных пользователем папках от несанкционированного изменения или удаления (отключена по умолчанию) |
||||
Антивирусная сеть.Обеспечит управление защитой всех семейных компьютеров |
||||
Антивор.Поможет найти мобильное устройство в случае его утери или кражи и при необходимости удаленно стереть с него конфиденциальную информацию. |
||||
Аудитор безопасности.Произведет диагностику и анализ безопасности мобильного устройства, предложит решения для устранения выявленных проблем и уязвимостей. |
||||
Фильтр звонков и СМС.Оградит от нежелательных звонков, СМС-сообщений и рекламных рассылок. |